The IntelligentGraph-way or the Groundhog-way to efficient data analytics.pdf
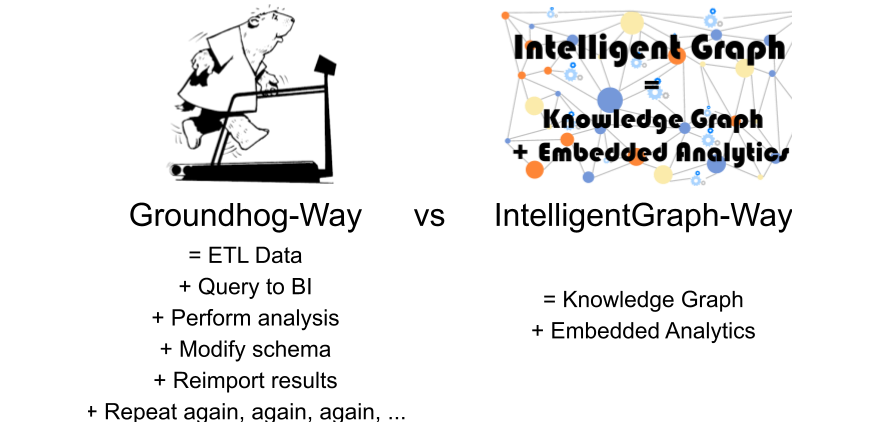
Data is rather like poor red wine: it neither travels nor ages well. IntelligentGraph avoids data traveling by moving analysis into the knowledge graph rather than moving data to the analysis engine, obsoleting the groundhog-analysis-way
Solving data analysis, the IntelligentGraph-way
Data is streamed to the IntelligentGraph datastore, and then analysis/calculation nodes are added to that graph which is accessible to all and by all applications.
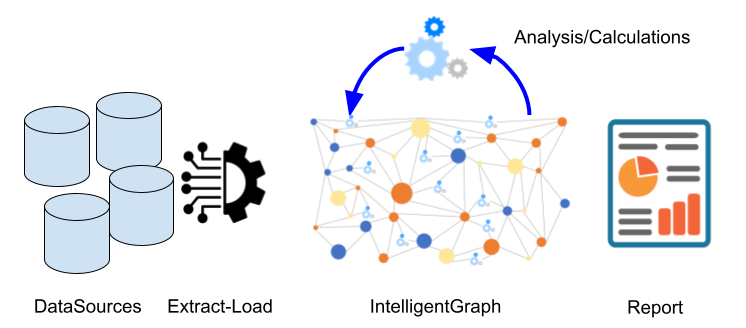
The IntelligentGraph-way of data-analysis is to:
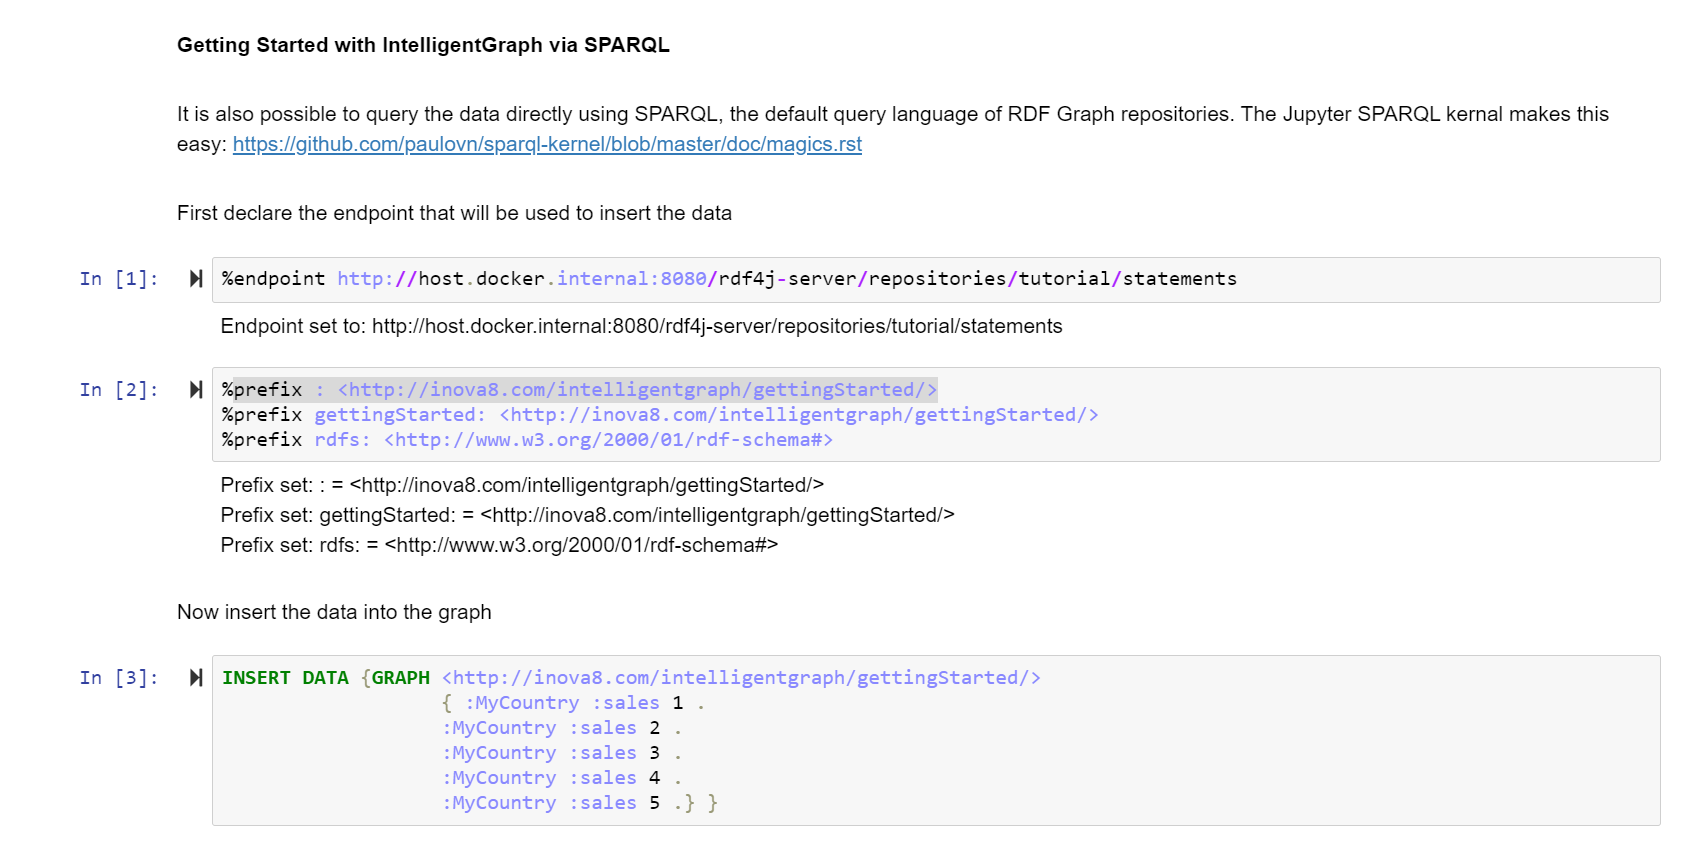
- Extract-Load (losslessly) the source data into an Intelligent Knowledge Graph
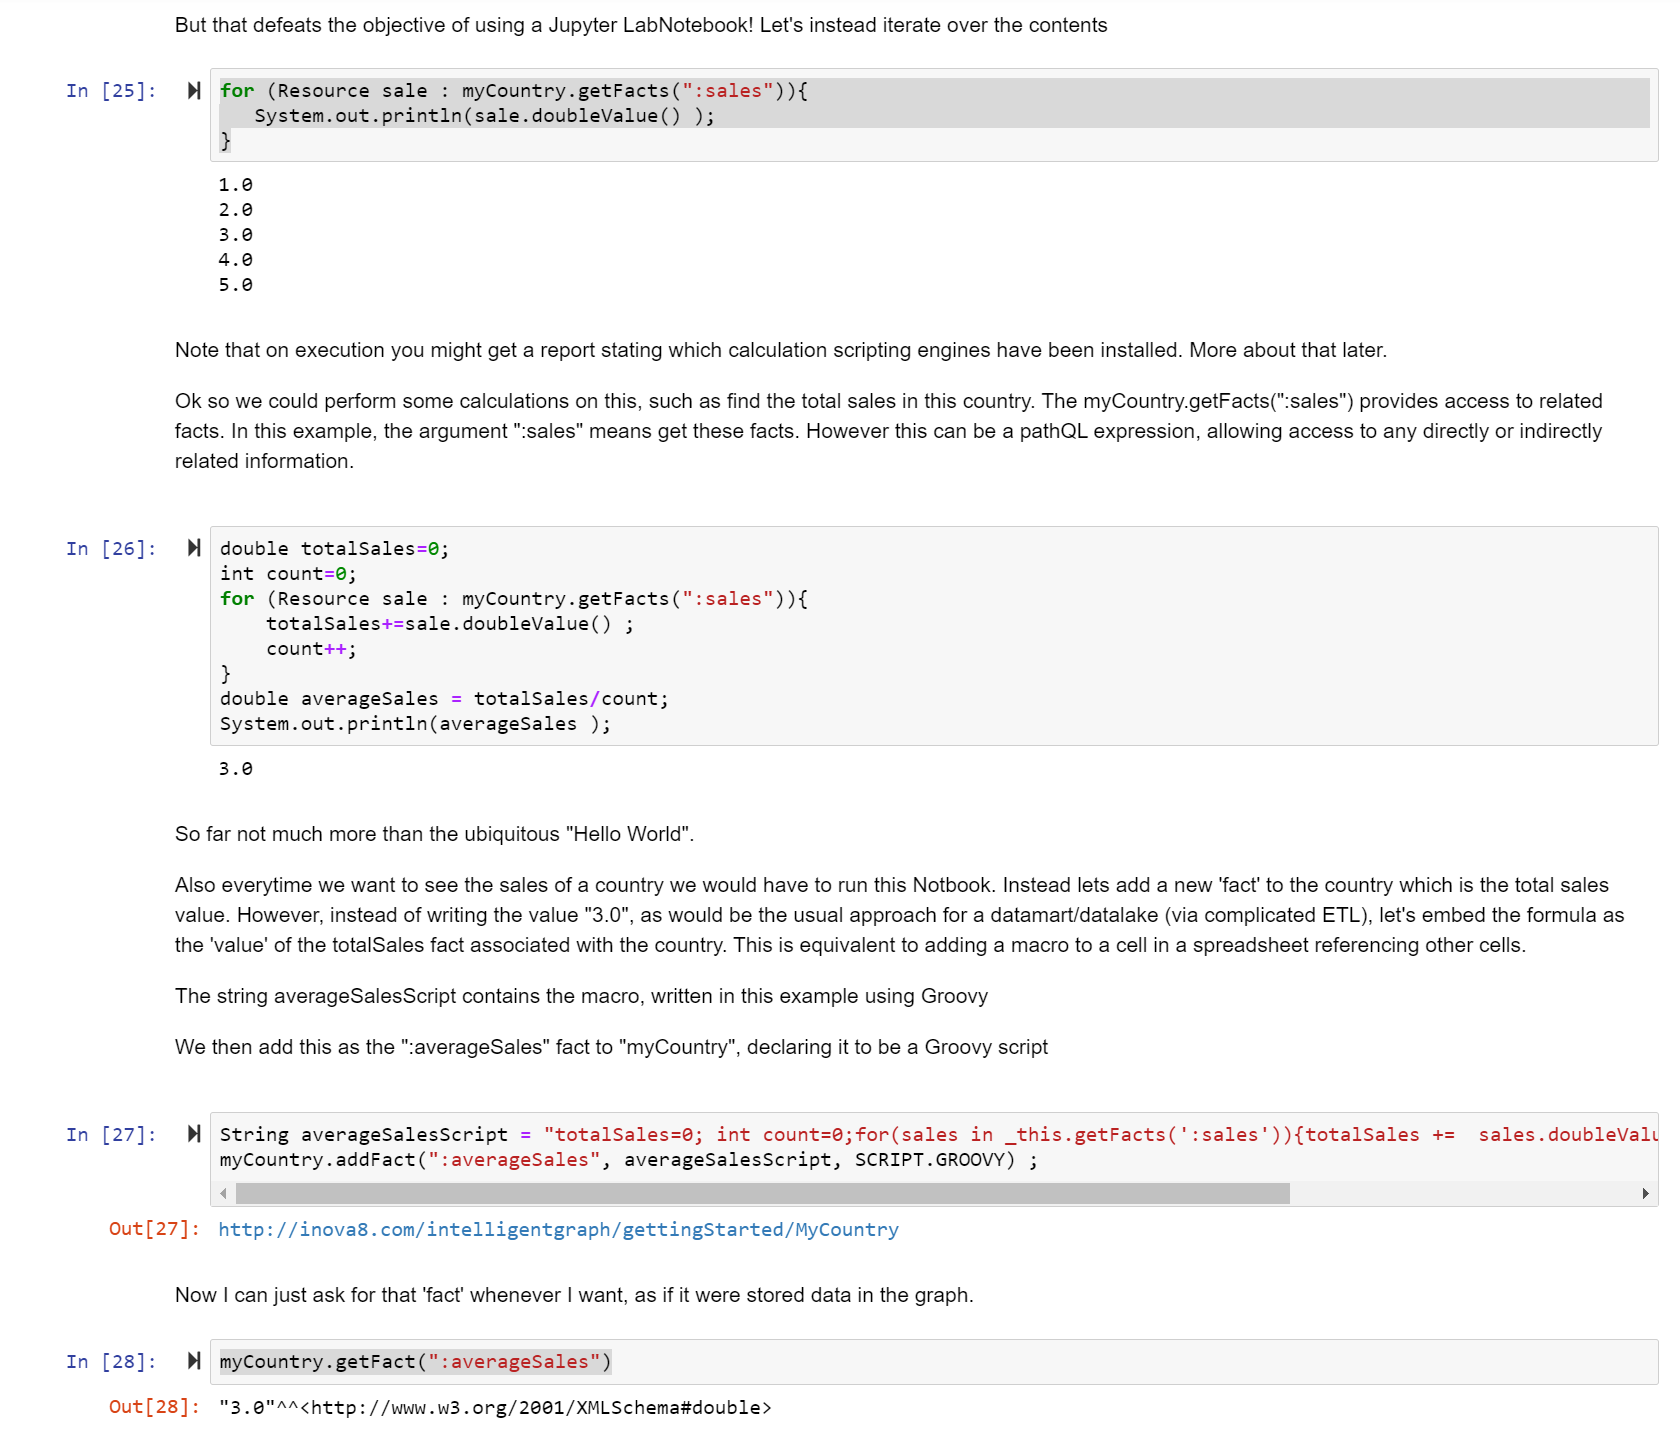
- Add analysis/calculation nodes to the KnowledgeGraph which calculate additional analysis values, aggregations, etc.
- Report results, using any standard reporting tool
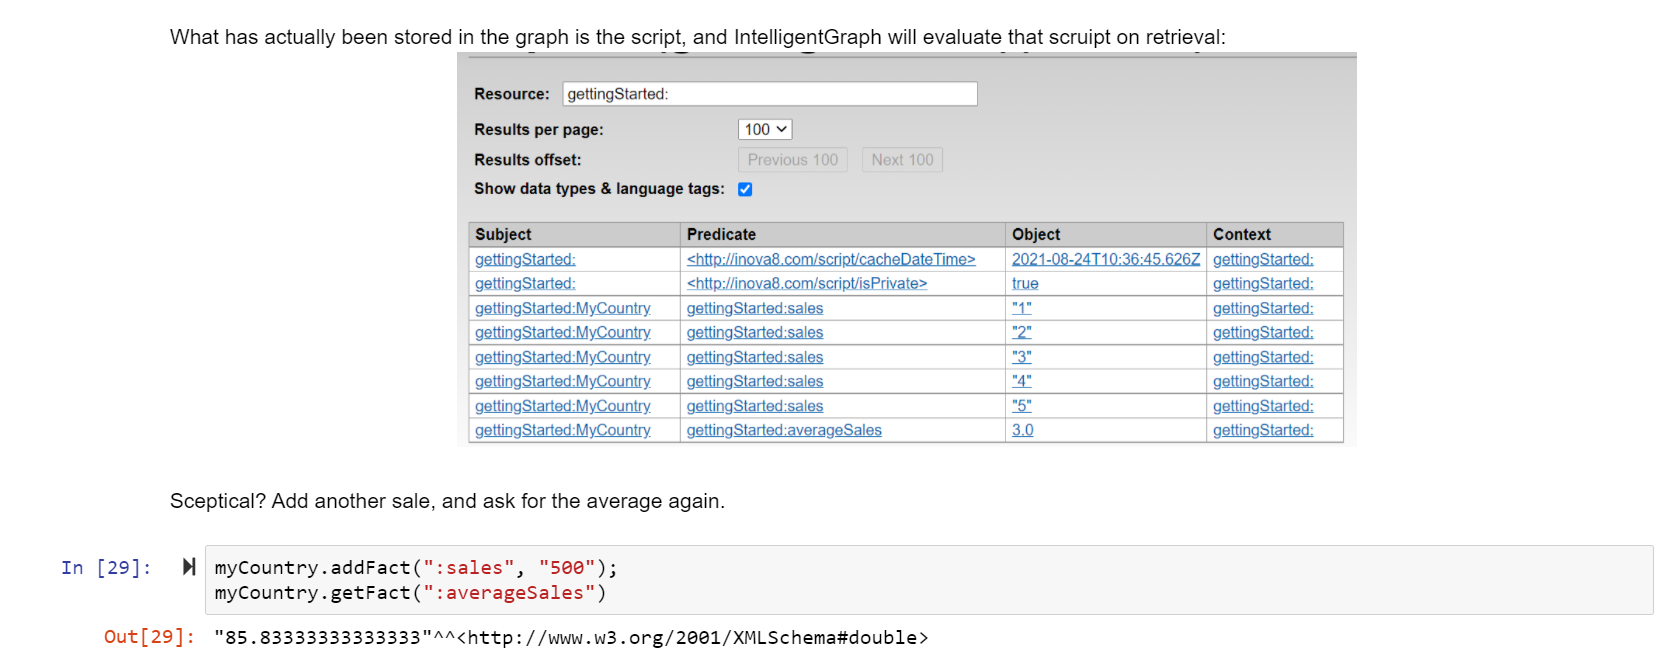
- Add more analysis/calculation nodes as additional requests come through. These new calculations can refer to the existing results
- … relax, you’ve become the star data analyst:-)
Solving data analysis, the Groundhog-way
Data is in the operational data-sources, data is staged in a data-warehouse/mart/lake, then the analysis is done by the analysis engine (aka Excel), right? And like poor red wine, constantly moving data damages it.
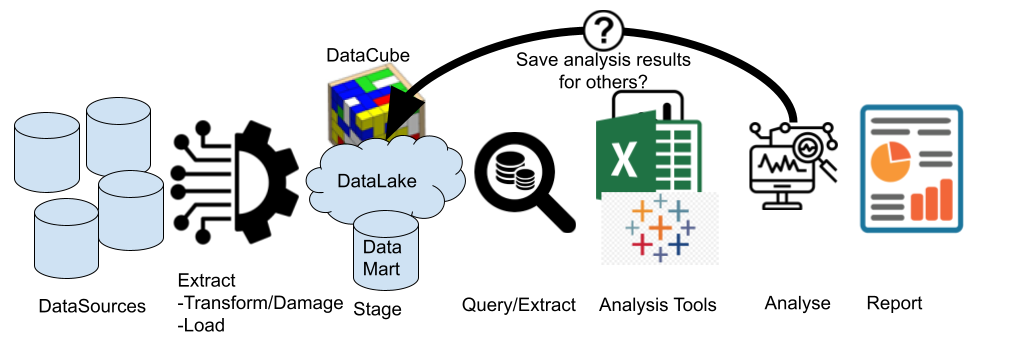
The Groundhog-way of data analysis is to:
- Extract-Transform(aka probably damage the data as well)-Load the source data into a data-warehouse/mart/lake just to make it ‘easier’ to access.
- Realizing the required analytical results are not in the data-warehouse/mart/lake, extract some data into Excel/PowerBI/BI-tool-of-choice where you can write your analysis calculations, aggregations, etc.
- Report analysis results, but forget to or cannot put the analysis results back into the data-warehouse/mart/lake.
- Repeat the same process every time there is a similar (or identical) analysis required.
- … don’t relax, another analysis request shortly follows 🙁
IntelligentGraph Benefits
IntelligentGraph moves analysis into the knowledge graph rather than moving data to the analysis engine, avoiding the groundhog-analysis-way:
- Improves analyst performance and efficiency
- Eliminates the need for analysts to create ELT to move data to the analysis engine.
- Simplifies complex calculations and aggregations
- PathQL language greatly simplifies navigating and aggregating throughout the graph.
- Ensures calculation and KPI concurrency
- Calculations are performed in-situ with the data, so no need to re-export data to the analysis engine to view updated results.
- Uses familiar scripting language
- Scripts expressed in any of multiple scripting languages including Python, Javascript, Groovy, and Java.
- Improves analysis performance and efficiency
- Time-to-answer reduced or eliminated as analysis is equivalent to reporting
- Ensures analysis effort is shared with all
- Analysis results become part of the graph which can be used by others ensuring consistency.
- Self-documenting analysis path to raw data
- The IntelligentGraph contains calculation scripts that define which calculations will be performed on what data (or other calculation results).
- Improves analysis accuracy by providing provenance of all calculations
- Trace of any analysis through to raw data is automatically available.
- Simplifies reporting
- Reporting tools can be used that focus on report appearance rather than calculation capability since the latter is performed in the IntelligentGraph.
- Highly scalable
- IntelligentGraph is built upon the de-facto graph standard RDF4J, allowing for the use of any RDF4J compliant datastore.
- Standard support
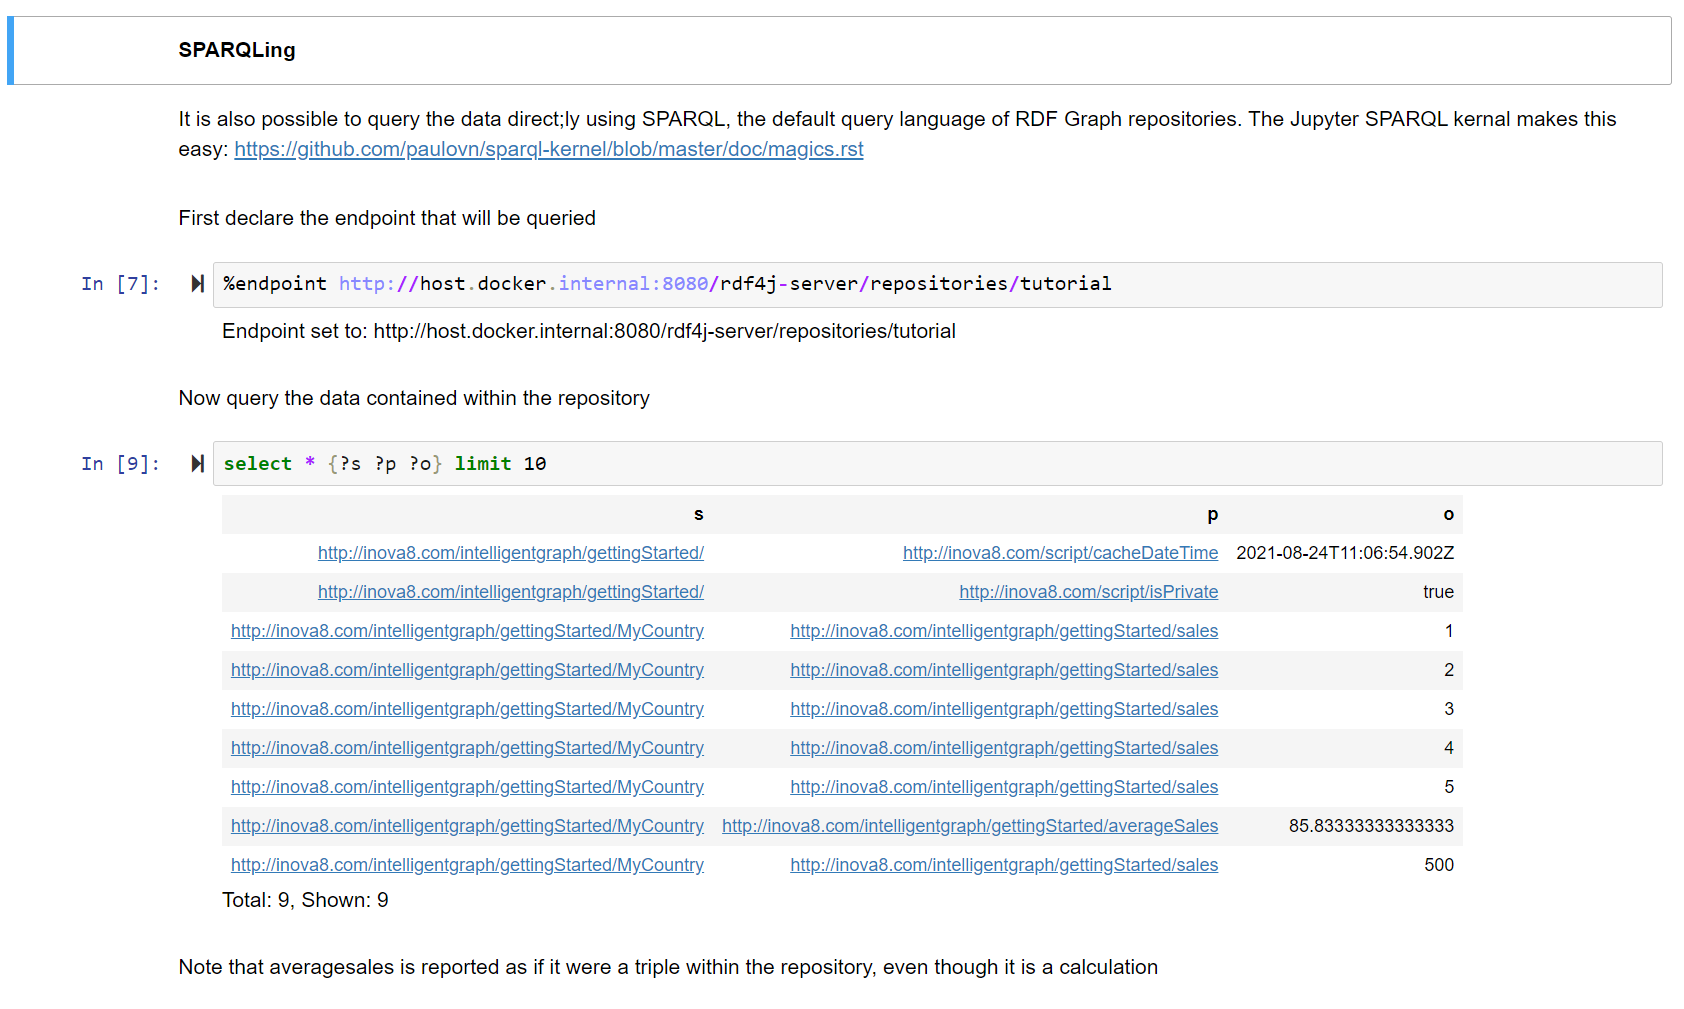
- Access to IntelligentGraph for querying, reporting, and more is unchanged from any RDF-based KnowledgeGraph.
- Evolutionary, not revolutionary modeling and analysis
- Graph-based models offer the ability to evolve as data analysis needs grow, such as adding new dimensions to the data, unlike a ‘traditional’ data mart or warehouse which usually require a rebuild.
- Creates the Intelligent Internet of Things
- Scripts can access external data, such as IoT, on-demand allowing IoT-based calculations and analysis to be performed in-situ.
- Eliminates spreadsheet-hell
- All spreadsheet calculations and aggregations can be moved into the graph, leaving the spreadsheet as a presentation tool. This eliminates the problem of undocumented calculations and inconsistent calculations in different spreadsheets.