IntelligentGraph embeds calculation and analysis capability within RDF knowledge graphs, rather than forcing analysis to be undertaken by exporting query results to external analysis applications such as Excel.
IntelligentGraph achieves this by embedding scripts into the RDF knowledge graph which are evaluated when queried with SPARQL.
Scripts, written in a variety of languages such as JavaScript, Java, and Python, access the underlying graph using simple pathPatternQL navigation.
 IntelligentGraph=KnowledgeGraph+Embedded Analysis.pdf
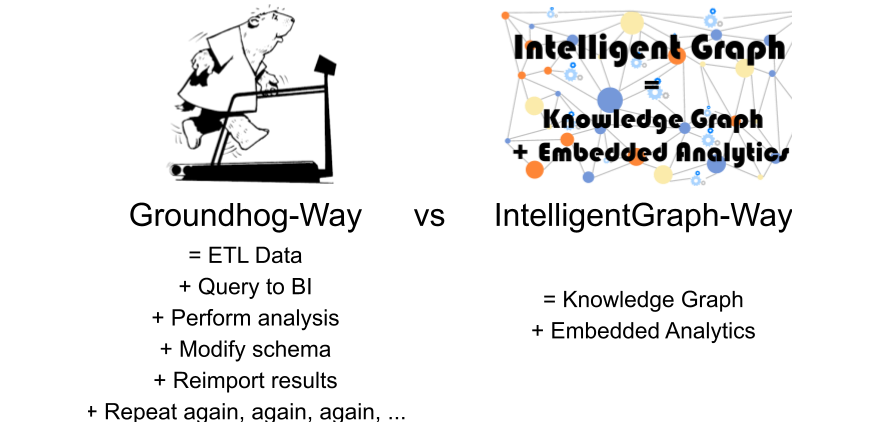
Why IntelligentGraph?
At present calculations over stored data are either delivered by custom code or exporting the stored data to spreadsheets. The data behind these tools is inevitably tabular. In fact, so dominant are spreadsheets for analysis that the spreadsheet itself becomes the ‘database’ with the inherent difficulties of syncing that data with the source system of record.
The real-world is better represented as a network or graph of interconnected things Therefore a knowledge graph is a far better storage organization than tables or objects. However, there is still the need to perform ad hoc numerical analysis over this data.
RDF DataCube can help organize data for analysis, but still the analysis has to be performed externally. Confronted with this dilemma, knowledge graph data would typically be exported in tabular form to a datamart or directly into, yet again, a spreadsheet where the analysis could be performed.
IntelligentGraph turns this approach on its head by embedding the calculations as scripts within the knowledge graph. These scripts are evaluated on query, and utilise the data in situ: no concurrency issues.. This allows the calculations to have knowledge of its neighbouring nodes and edges, just like Excel cells can access other cells in the spreadsheet. Access to other nodes within the graph uses pathPatternQL navigation.
Example Data and Analysis
An Industrial Internet of Things (IIoT) application is connecting all the measurements about a process plant, such as an oil refinery, into a knowledge graph that relates the measurements to the material flows through the process equipment.
Although there is an abundance of measurements and laboratory analyses available, the values required for operating and performance monitoring are not (and mostly cannot) be directly measured.
For example:
- Stream Mass-Flow: direct mass flow measurements are rare. Instead, a volume flow measurement is used in conjunction with a measured material density to calculate the mass-flow
- Unit Mass Flow Throughput: this is calculated by summing either all feed stream mass flows or product stream mass flows.
- Unit Mass Balance: this is calculated by differencing the feed from product mass flows
- Product Stream Yield: this is the ratio of a stream’s mass-flow to the unit to which the stream is connected throughput.

Figure 1: Typical Process Flow Sheet
These are simple examples; however, they show the reliance on the knowledge graph structure to perform the analysis.
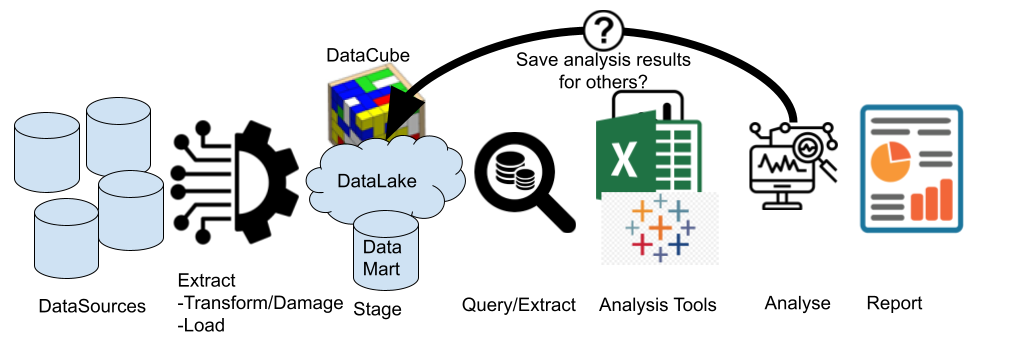
Solving data analysis, the traditional way
Data is in the database, analysis is done by the analysis engine (aka Excel), right?

Figure 2: Data analysis the traditional way
In this scenario, the local power user sets up a query to export data from the database and converts to a format that can be imported into Excel. Ever increasingly complex formulae are then written to wrangle the data into the results that are required.
Why is the spreadsheet approach risky?
- The analysis is now separated from the data. Data changes will not be reflected in the analysis. Worse still, changes to the analysis might not be propagated to all the spawned copies of the spreadsheet.
- The data is separated from the analysis. The analysis results are rarely re-imported into the data store where data vs analysis could be performed. Instead, even more data is extracted into the spreadsheet.
- The difficultly of managing the separation of data from analysis becomes so great that in many cases the database is dispensed with entirely and the spreadsheet becomes the de-facto database.
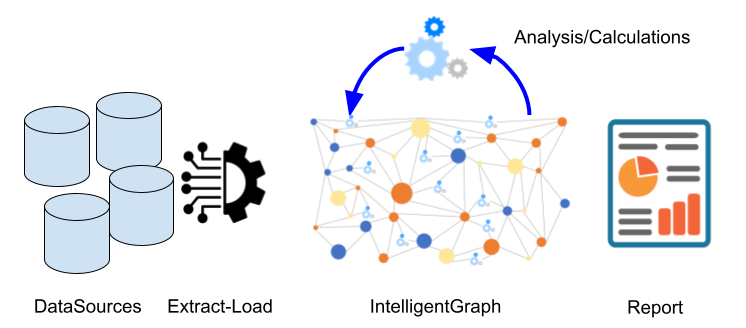
Solving data analysis with an IntelligentGraph
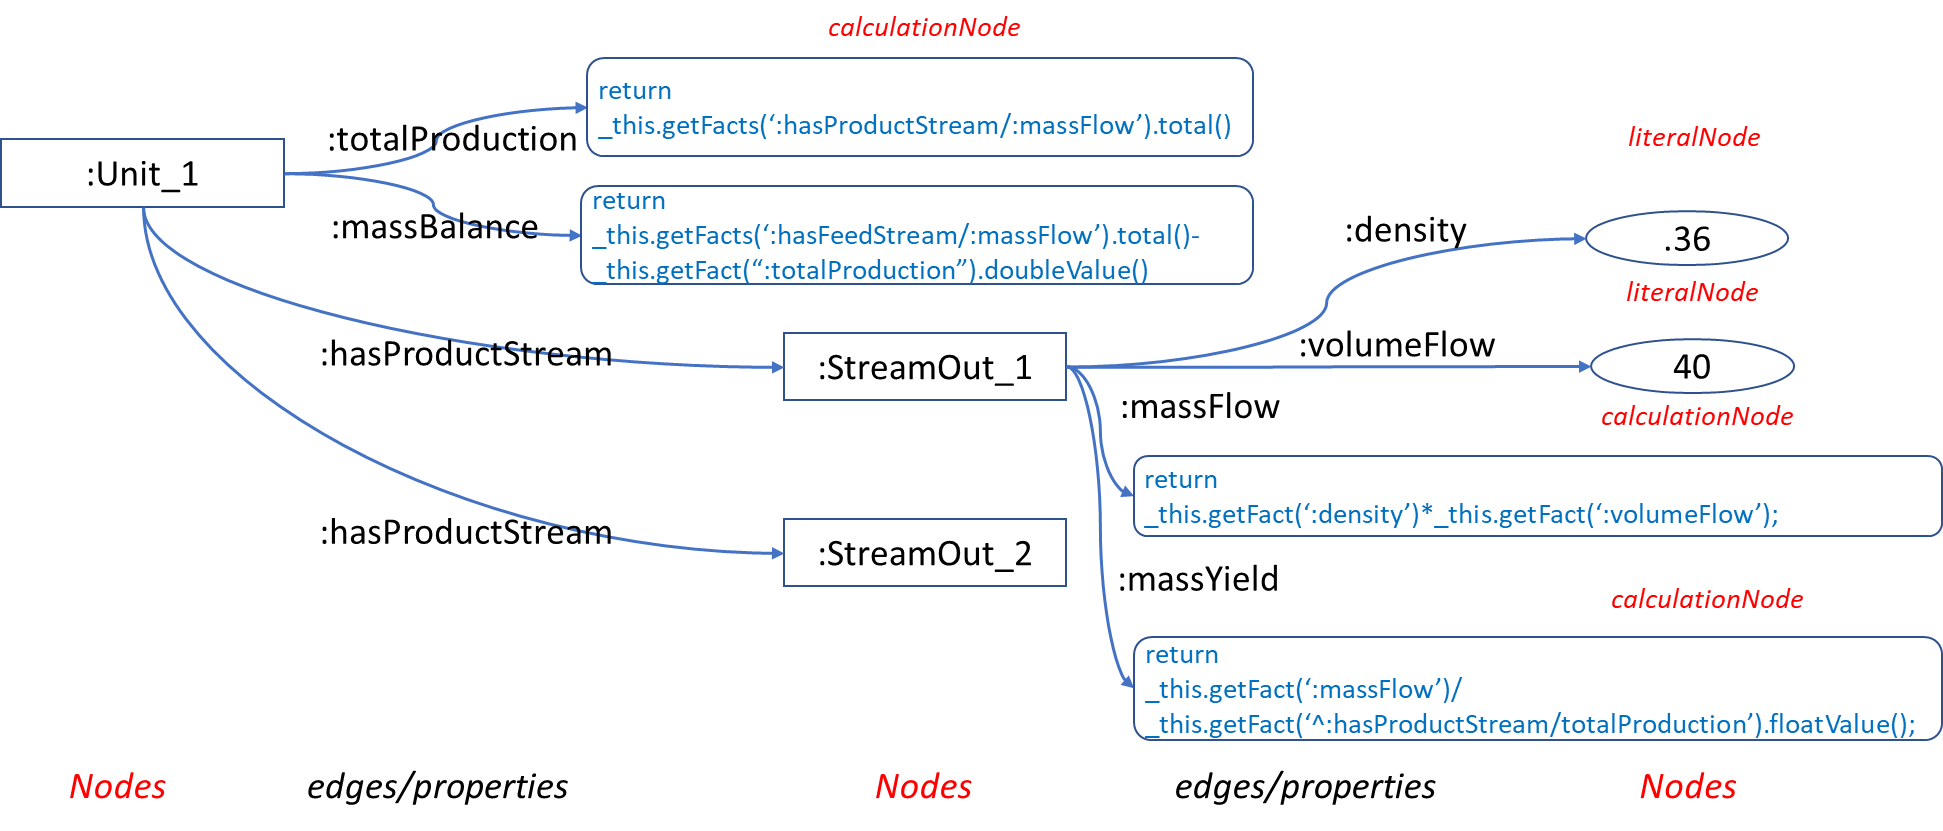
The beauty of Excel is that a cell can contain either a value or a formula that can reference other cell’s values. Why not do the same with a graph: a node can have edges that terminate with a literal value, or a formula that can reference other node’s values.
This is illustrated in the diagram below:
- The :massFlow property is not measured directly, so a formula is used for its value instead. This formula references $this, the node to which the calculation is attached, and uses the method getFact() to retrieve related values. The argument of getFact() is a pathPatternQL expression.
- The :totalProduction property is not measured directly, so a formula is used instead which iterates over all of the ‘stream out’ nodes, retrieving the value of the :massFlow for each stream. The :massFlow value is, of course, in turn a calculation.
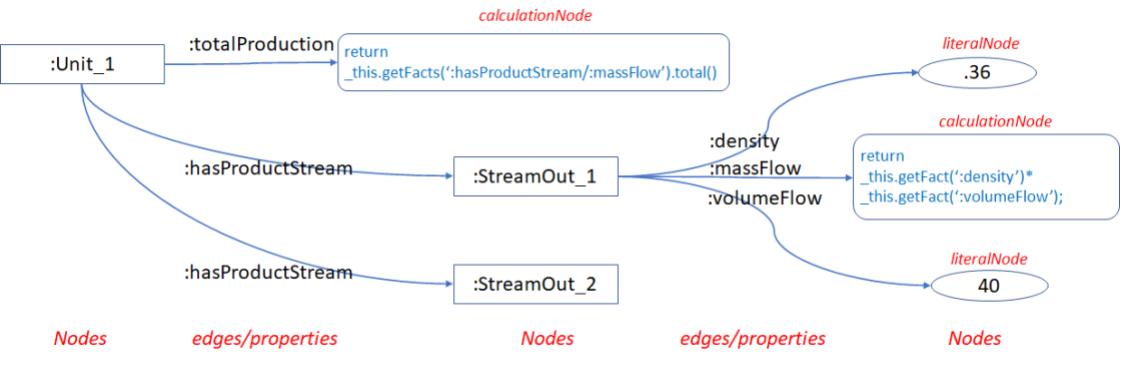
Figure 3: Intelligent Graph Data Analysis
Why is the IntelligentGraph approach so advantageous?
- There is no separation between data and analysis, removing the risk of stale and inaccurate data and calculations.
- The calculations embedded within the graph can take advantage of the knowledge that is contained within that graph. This makes the calculations far simpler than those that need to be embedded in spreadsheets.
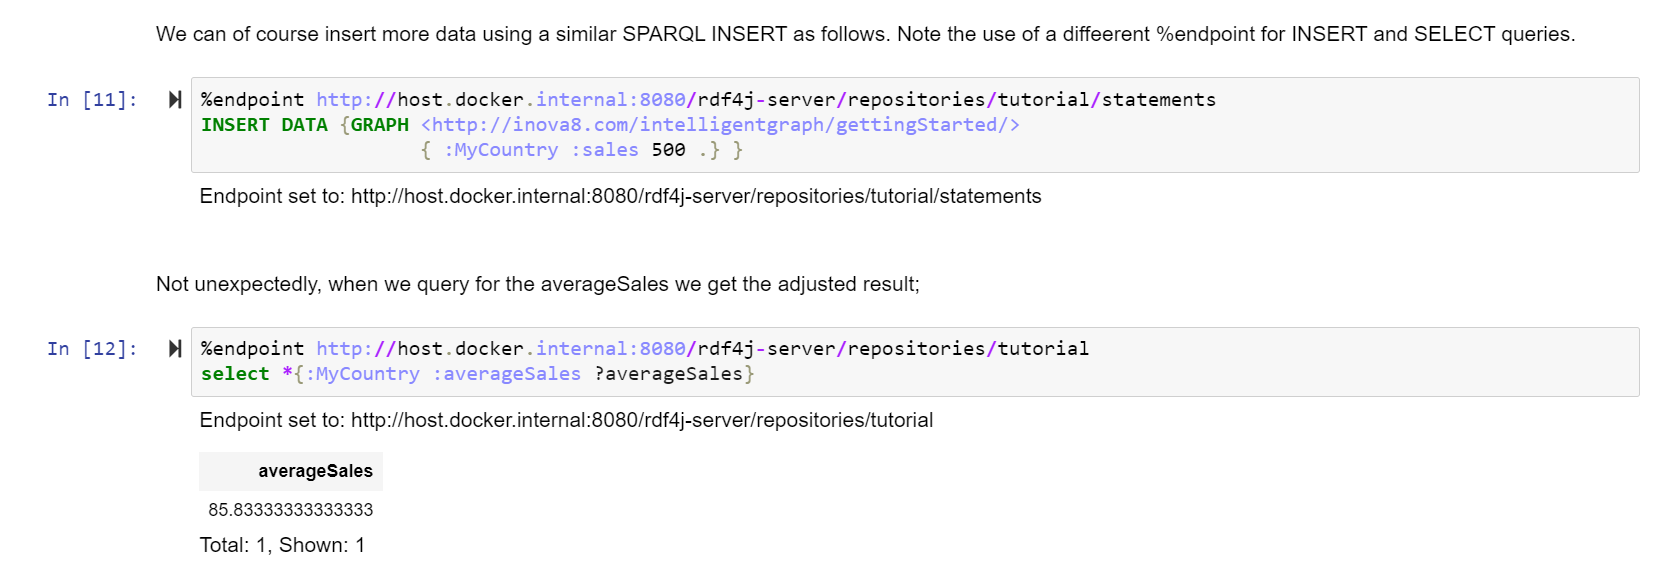
- The calculations will automatically utilize on the fly the changing knowledge.
How does IntelligentGraph Work?
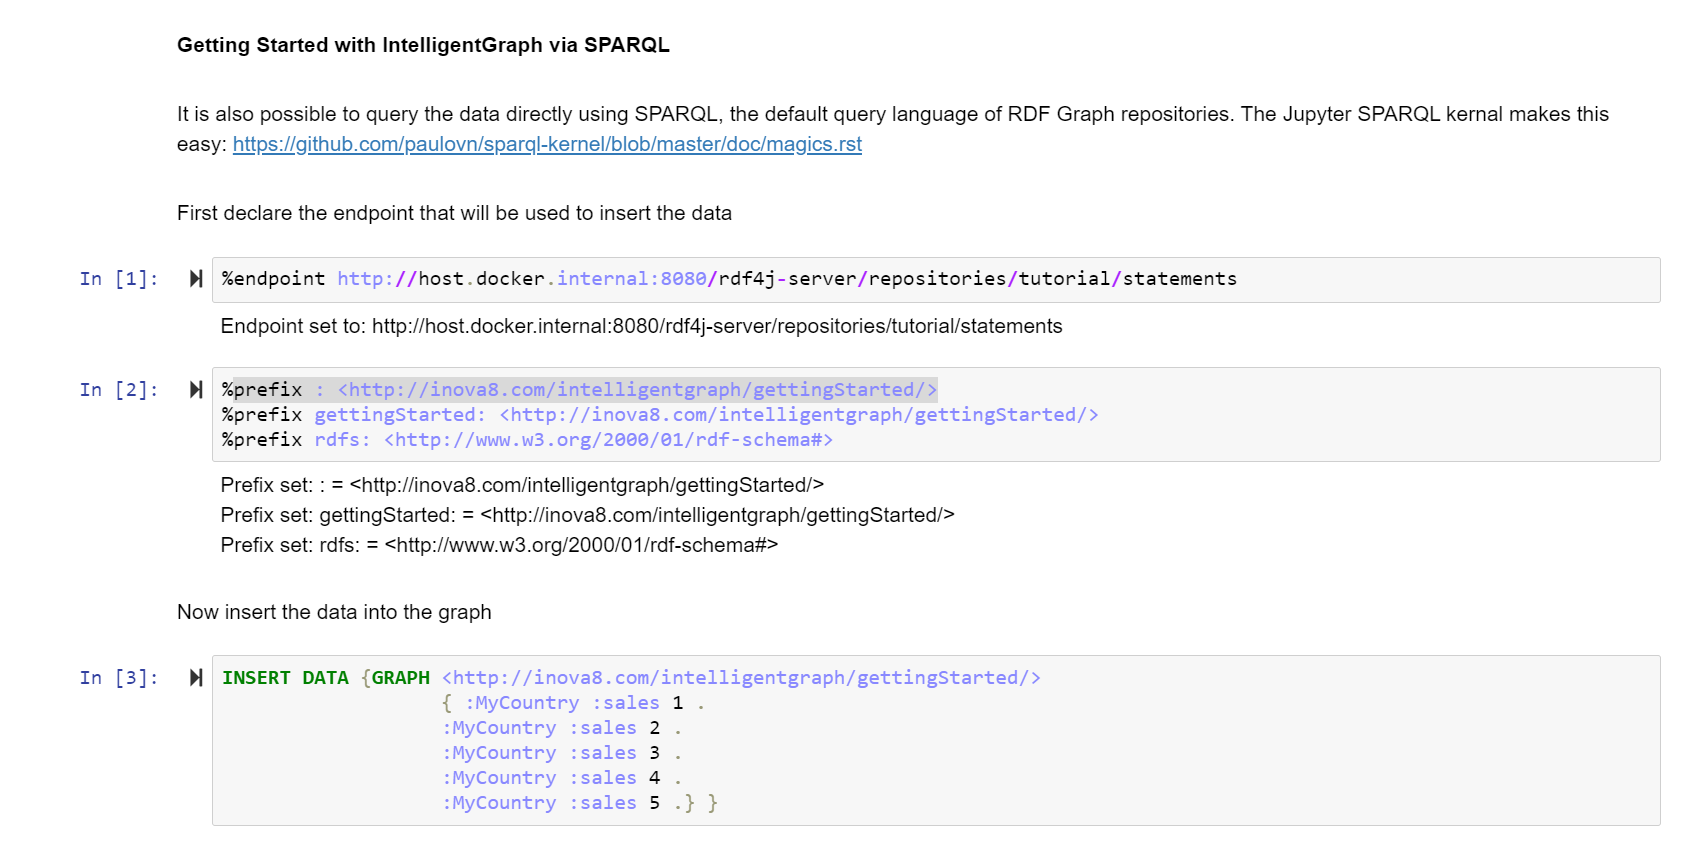
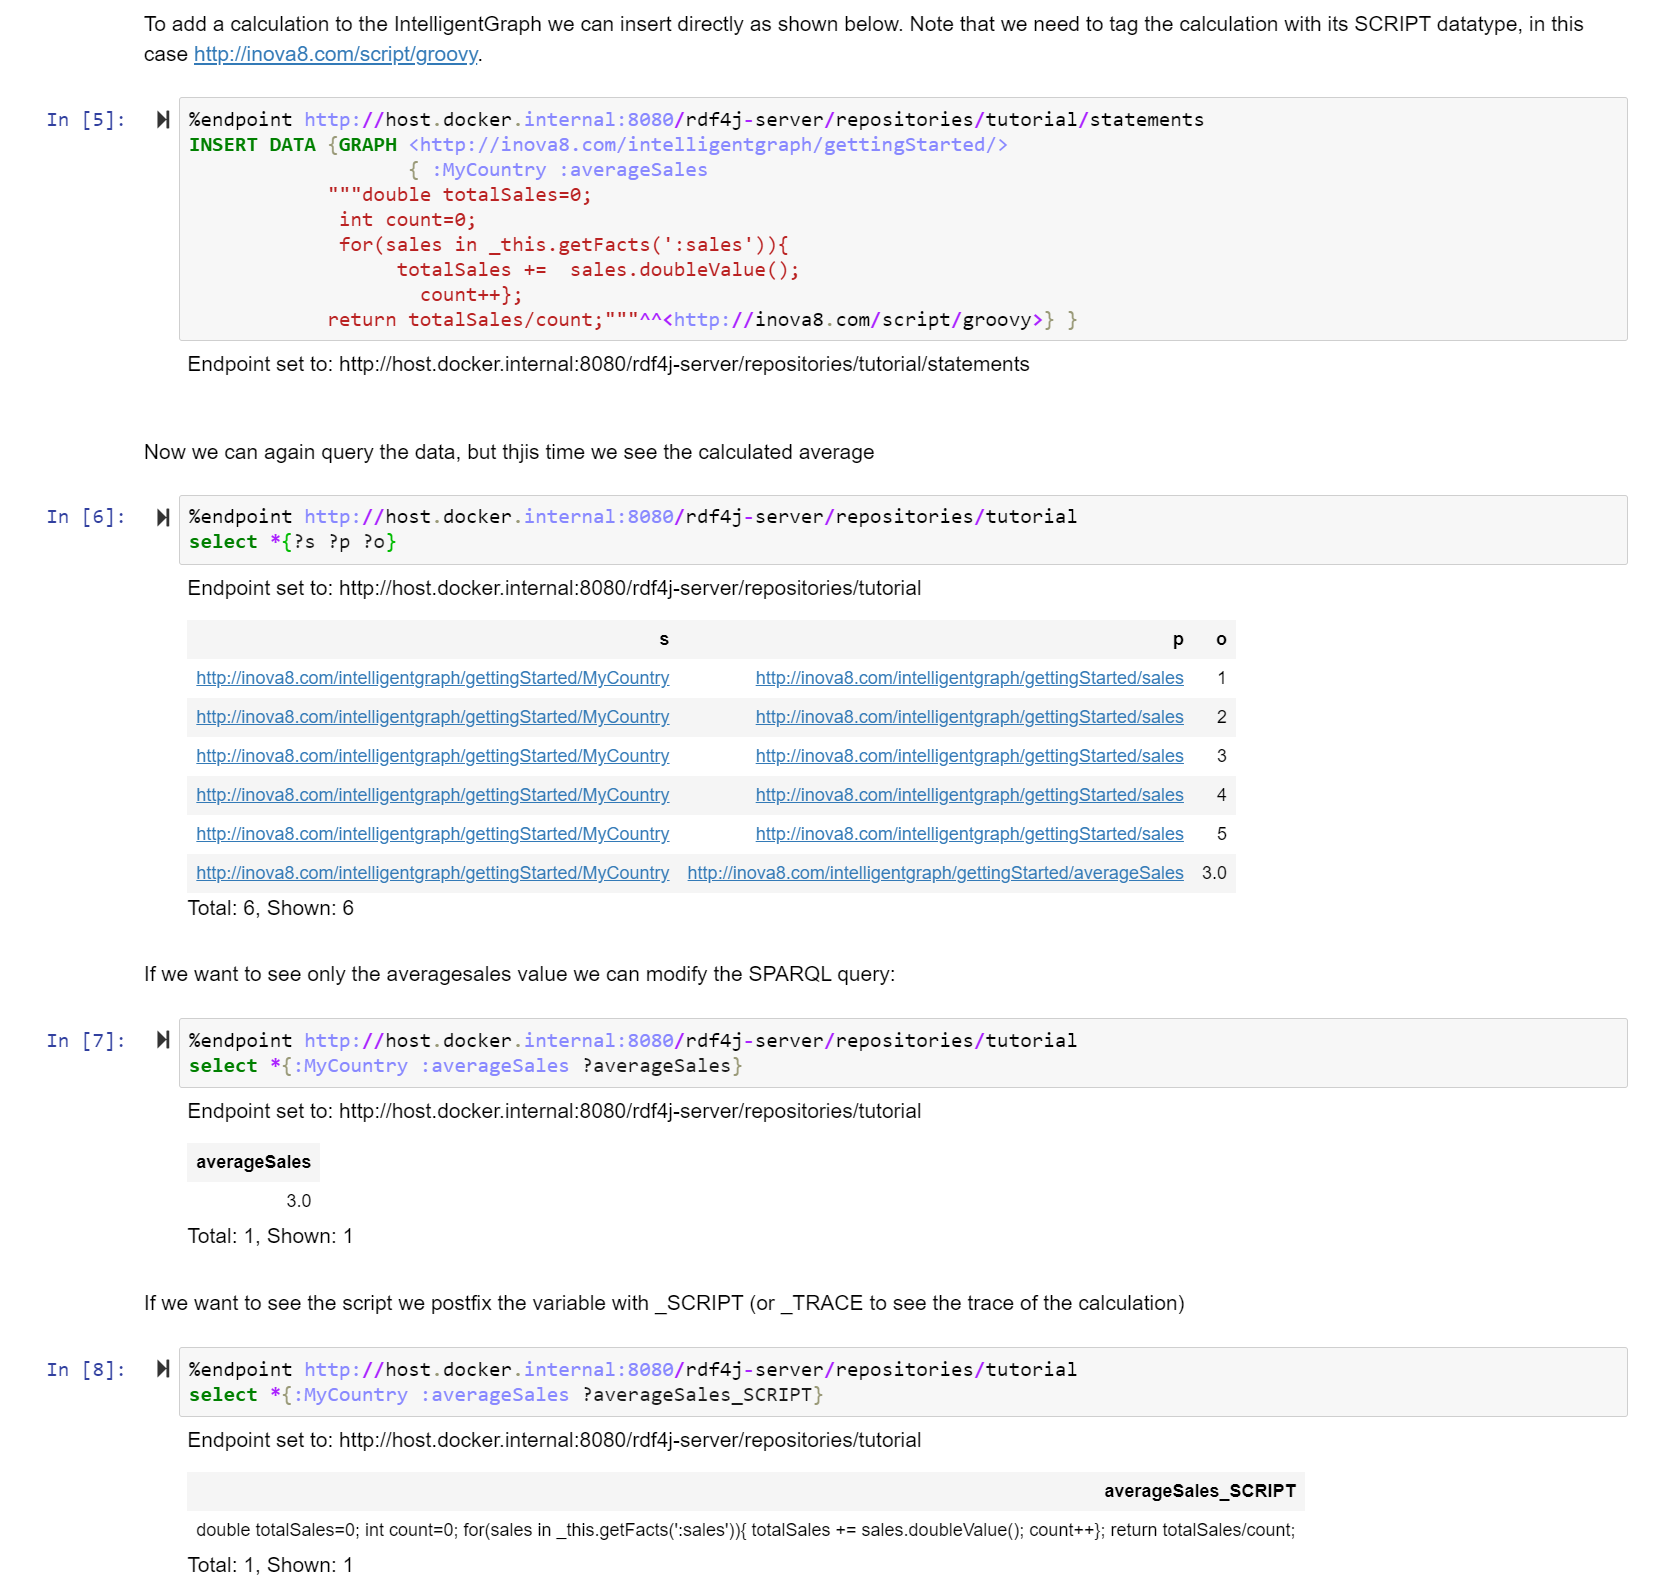
Analysis is embedded in an IntelligentGraph simply by adding script literals as object values of subjects with datatype of the scripting language (groovy, javascript, python etc).
The IntelligentGraph engine is provided as an RDF4J Stackable SAIL. This means that its capabilities can be combined with any other RDF4J capabilities. The choice of RDF storage remains the same as for any other RDF4J compliant framework.
Modeling with Scripts
Typically, a graph node will have associated attributes with values, such as a stream with volumeFlow and density values:
Stream Attributes:
:Stream_1
   :density ".36"^^xsd:float ;
   :volumeFlow "40"^^xsd:float .
Of course, in the ‘real-world’ these measured values are sourced from outside the KnowledgeGraph and change over time. IntelligentGraph can deal with both of these requirements.
The ‘model’ of the streams can be captured as edges associated with the Unit:
:Unit_1
   :hasProductStream :Stream_1 ;
   :hasProductStream :Stream_2 ;
.
Calculate Mass Flow
The calculations are declared as literals[1] with a datatype whose local name corresponds to one of the installed script languages:
:Stream_1 :massFlow
    "_this.getFact(':density')*
     _this.getFact(':volumeFlow');"^^:groovy .
Calculate Total Production
A typical performance metric is to understand the total production from a unit, which is not of course directly measured. However, it can be easily expressed using existing calculated values:
:Unit_1   :totalProduction
    "var totalProduction =0.0;
    for(Resource stream : _this.getFacts(':hasProductStream'))
    {
        totalProduction += stream.getFact(':massFlow');
    }
    return totalProduction; "^^:groovy .
Instead of returning the object literal value (aka the script), the IntelligentGraph will return the result value for the script.
We can write this script even more succinctly using the expressive power PathQL:
:Unit_1  :totalProduction
    "return _this.getFacts(':hasProductStream/:massFlow').total(); "^^:groovy
However, IntelligentGraph allows us to build upon existing calculations to simply express what would normally be difficult-to-calculate metrics, such as product yield or mass balance.
Calculate Mass Yield
Any production unit has different valued products. So a key metric is the yield of individual streams. This can easily be calculated as follows, using values that are themselves calculations.
var result= _this.getFact(":massFlow").floatValue()/
_this.getFact("^:hasStream/:totalProduction").floatValue();
result;
Calculate Mass Balance
Measurements are not perfect, nor is the operation of a unit. One of the first indicators of a problem is when the mass flow in does not match the mass flow out. This can be expressed as another calculated property of a Unit:
return _this.getFacts(":hasFeedStream/massFlow").total() -_this.getFacts(":totalProduction").total();
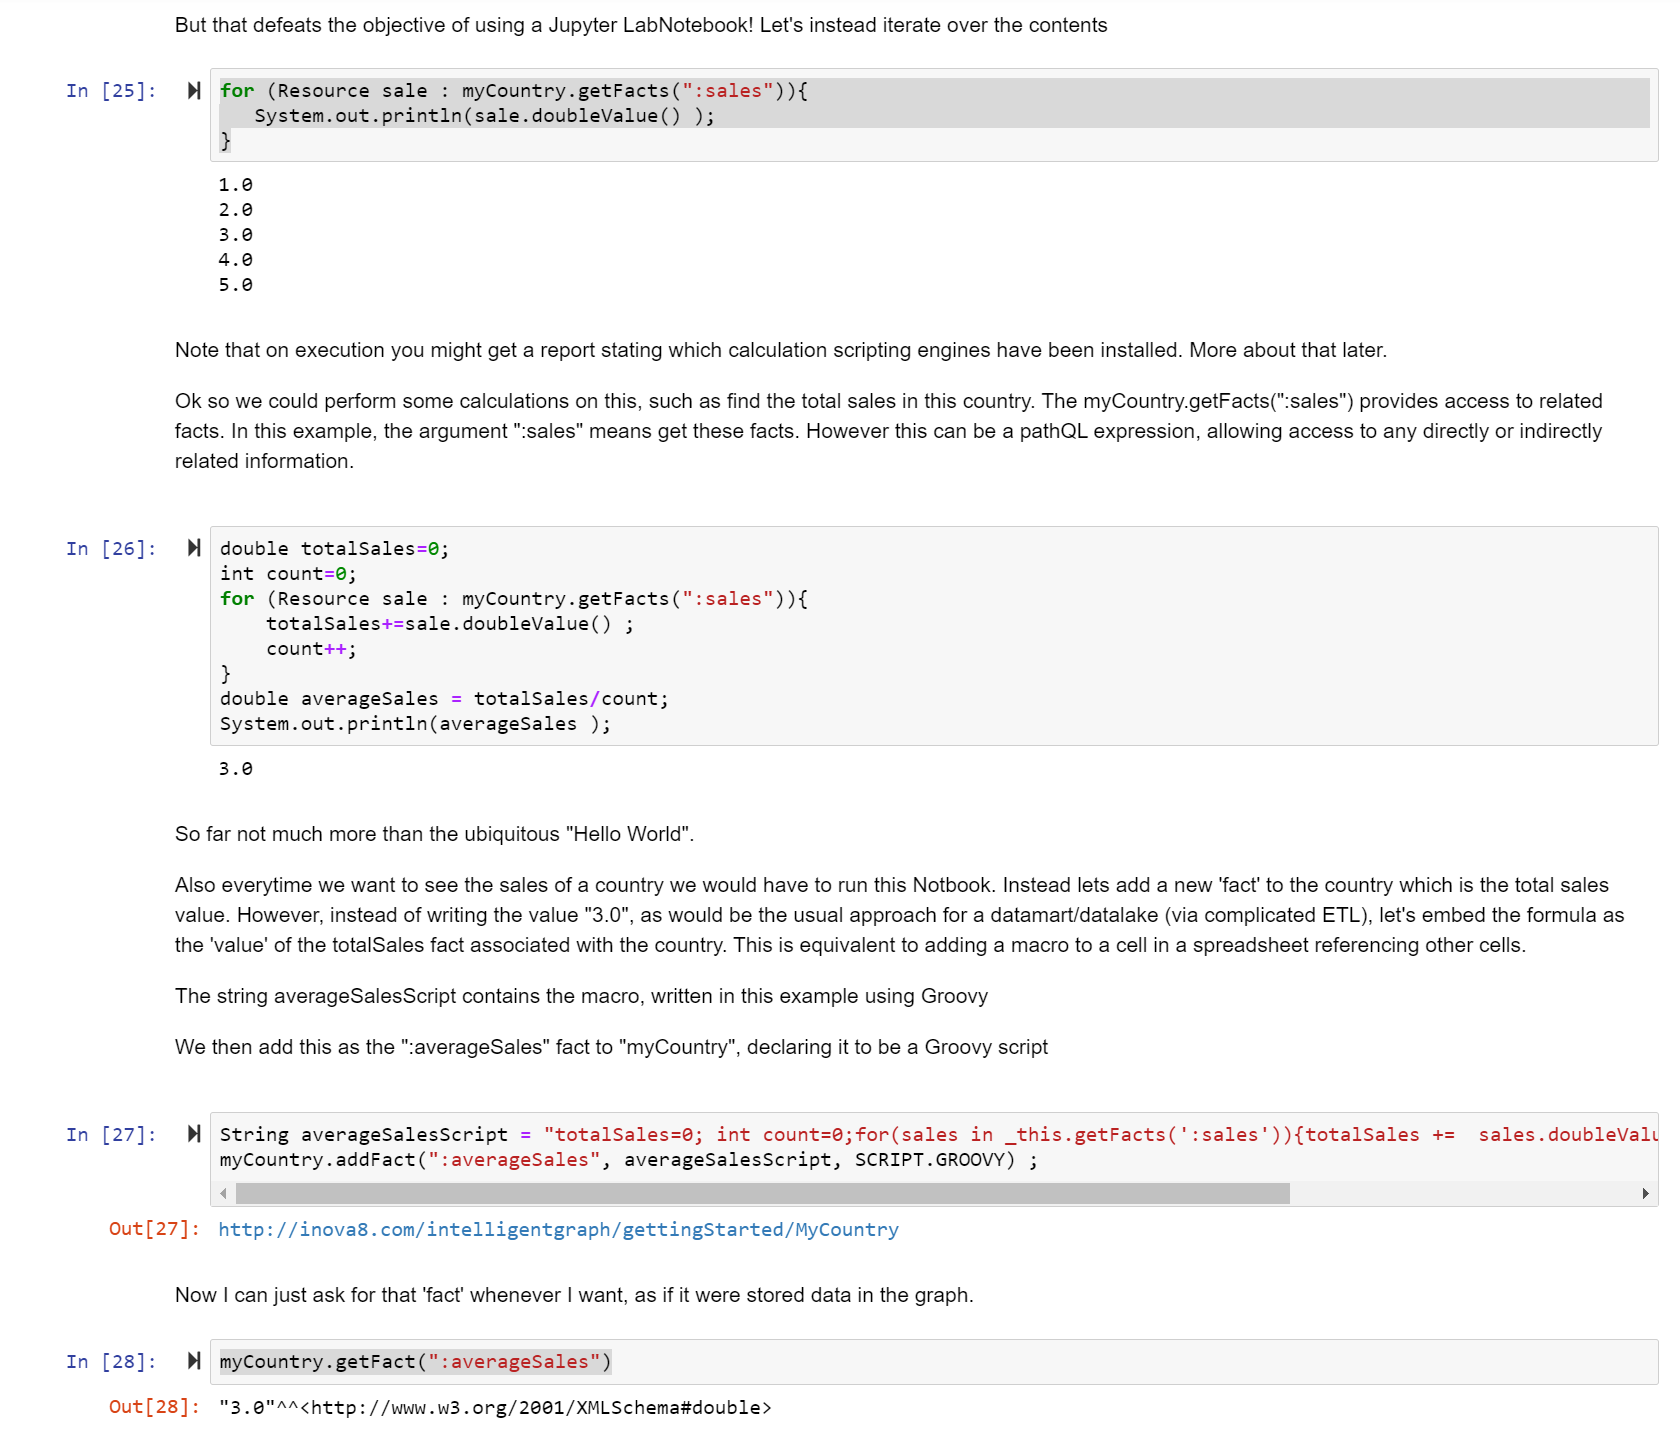
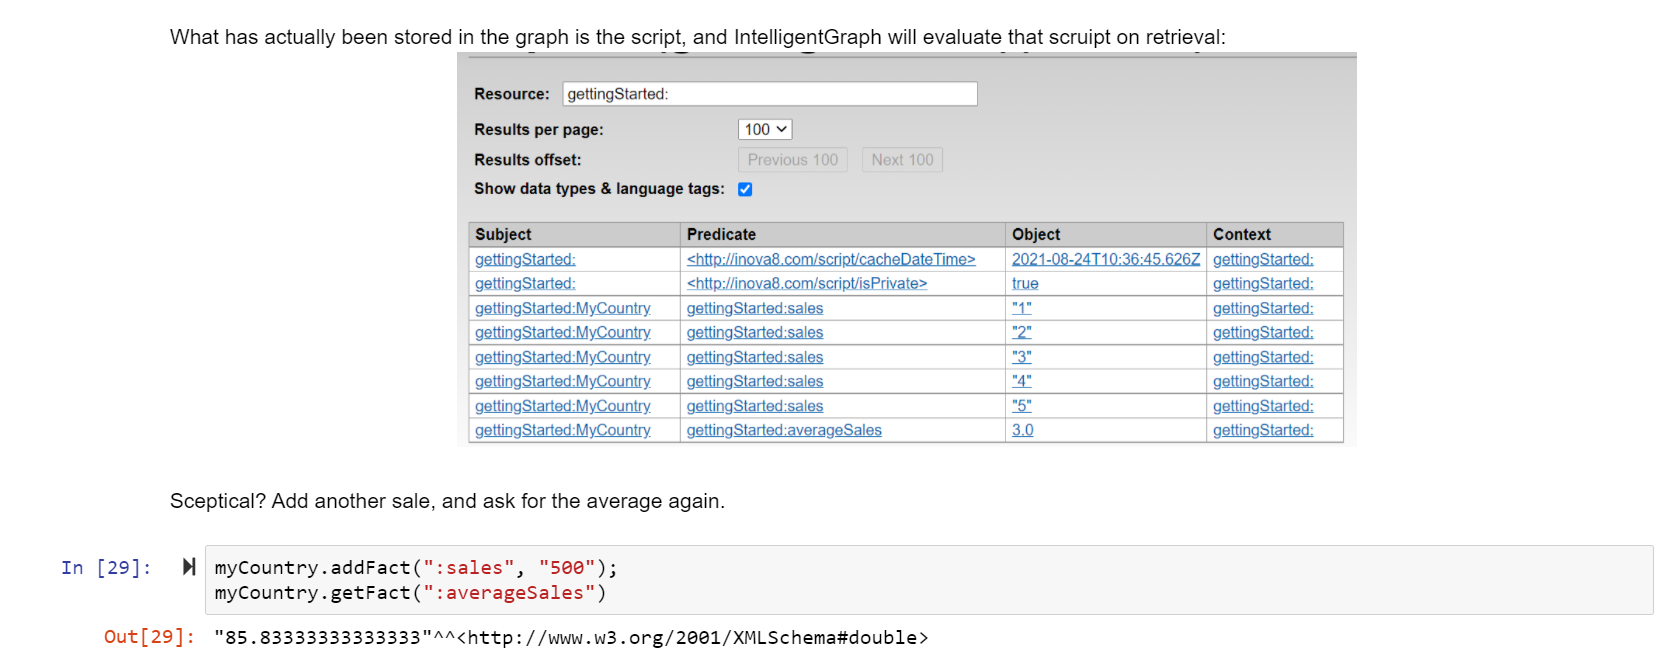
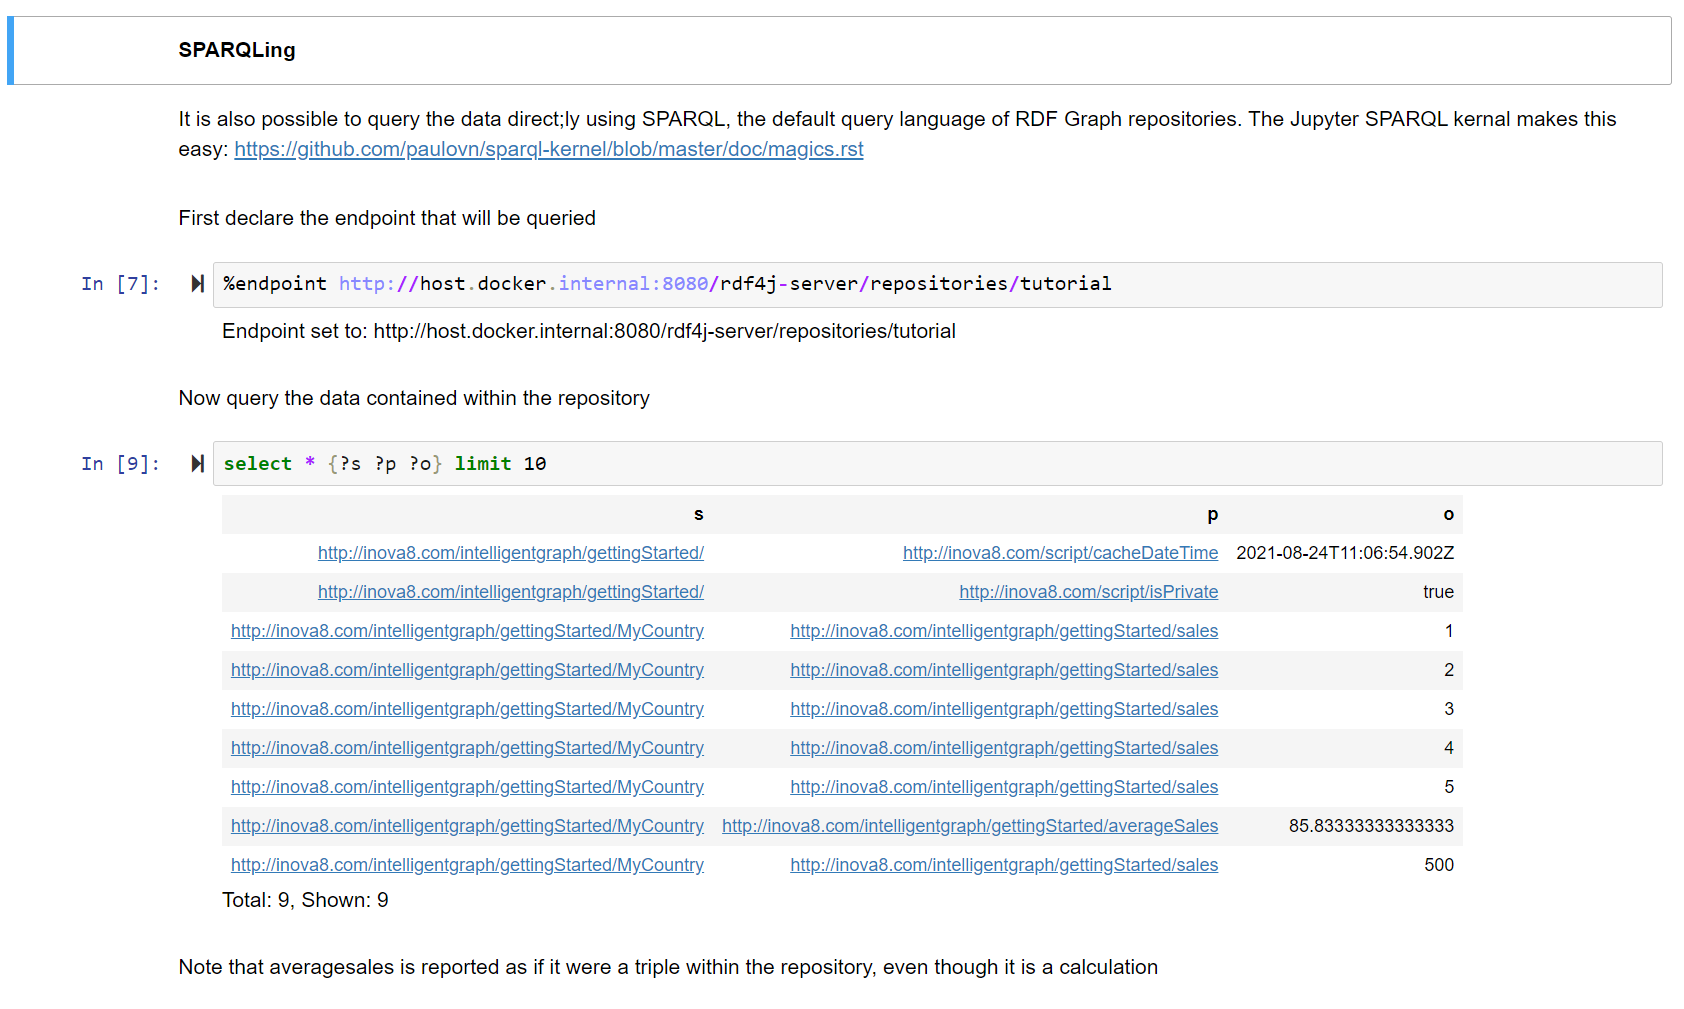
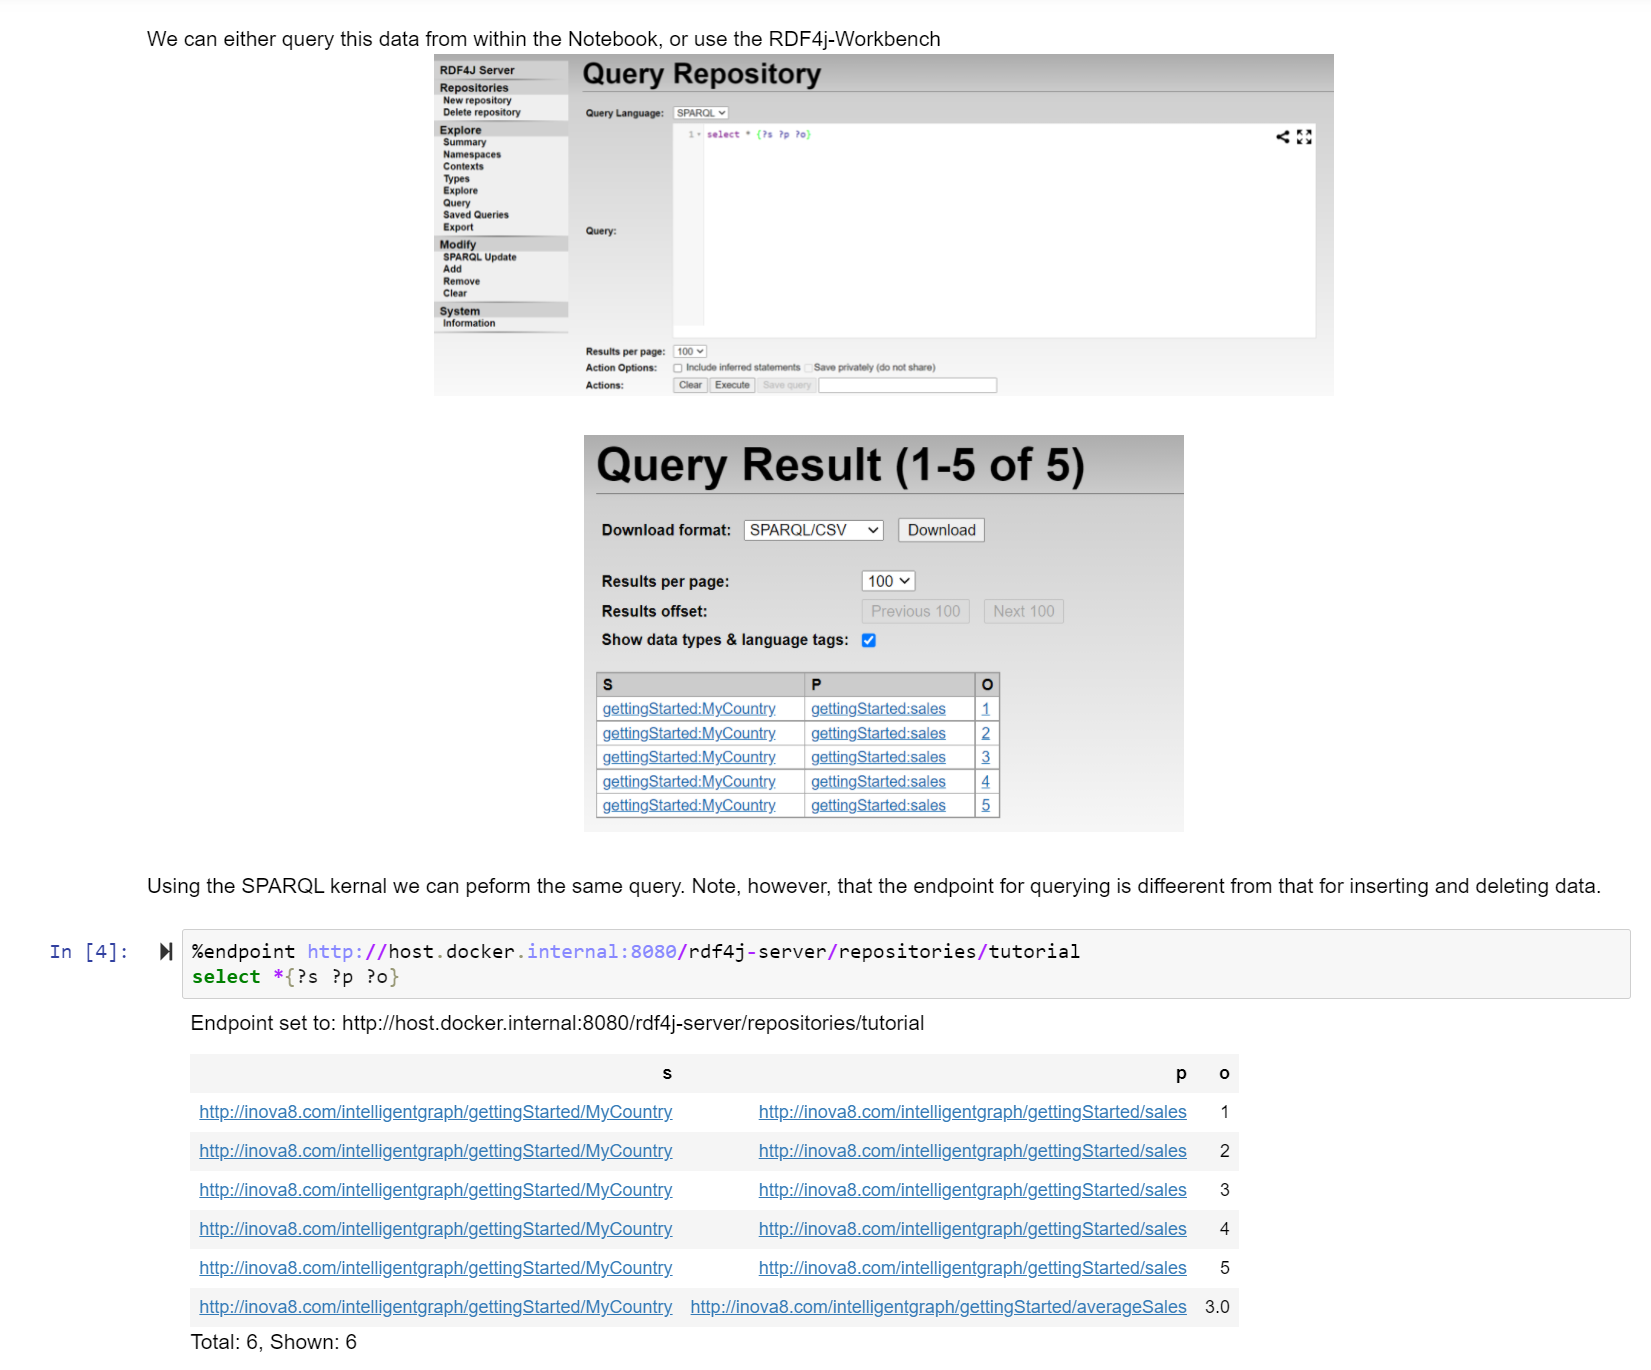
Querying Results
Access to the calculated values is via standard-SPARQL. However instead of returning the script literal, IntelligentGraph will invoke the script engine,
Thus to access the :massFlow calculated value, the SPARQL is simply:
select ?massFlow
{
 :Stream_1 :massFlow ?massFlow
}
If the script literal is required then the object variable can be postfixed with _SCRIPT:
select ?massFlow ?massFlow_SCRIPT
{
 :Stream_1 :massFlow ?massFlow, ?massFlow_SCRIPT
}
If a full trace of the calculation, including tracing calls to other scripts, is required then the object variable can be postfixed with _TRACE:
select ?massFlow ?massFlow_TRACE
{
 :Stream_1 :massFlow ?massFlow, ?massFlow_TRACE
}
How to Write IntelligentGraph Scripts?
Script Languages
Any Java 9 supported language can be used simply by making the corresponding language JAR available.
By default, JavaScript, Groovy, Python JAR are installed. The complete list of compliant languages is as follows
AWK, BeanShell, ejs, FreeMarker, Groovy, Jaskell, Java, JavaScript, JavaScript (Web Browser), Jelly, JEP, Jexl, jst, JudoScript, JUEL, OGNL, Pnuts, Python, Ruby, Scheme, Sleep, Tcl, Velocity, XPath, XSLT, JavaFX Script, ABCL, AppleScript, Bex script, OCaml Scripting Project, PHP, Python, Smalltalk, CajuScript, MathEclipse
Script Context Variables
In addition, each script has access to the following predefined variables that allow the script to access the context within which it is being run.
- _this, a Thing corresponding to the subject of the triples for which the script is the object. Since this available, helper functions are provided to navigate edges to or from this ‘thing’ below:
- _property, a Thing corresponding to the predicate or property of the triples for which the script is the object.
- _customQueryOptions, a HashMap<String, Value> of name/value pairs corresponding to the pairs of additional arguments to the SPARQL extension function. These are useful for passing application-specific parameters.
- _builder, a RDF4J graph builder object allowing a graph to be constructed (and manipulated) within the script. A graph cannot be returned from a SPARQL function. However the IRI of the graph can be returned, and any graph created by a script will be persisted.
- _tripleSource, the RDF4J TripleSource to which the subject, predicate, triple belongs.
Fact and Path Functions
The spreadsheets’ secret sauce is the ability of a cell formula to access values of other cells, either individually or as a set. The IntelligentGraph provides this functionality with several methods associated with Thing, which are applicable to the _this Thing initiated for each script with the subject Thing.
Thing.getFact(String pathPattern) returns Value
Returns the value of node referenced by the pathPattern, for example “:volumeFlow” returns the object value of the :volumeFlow edge relative to _this node. The pathPattern allows for more complex path navigation.
Thing.getFacts(String pathPattern) returns Values
Returns the values of nodes referenced by the pathPattern, for example “:hasProductStream” returns an iterator for all object values of the :hasProductStream edge relative to _this node. The pathPattern allows for more complex path navigation.
Thing.getPath(String pathQL) returns Path
Returns the first (shortest) path referenced by the pathQL, for example “:parent{1..5}” returns the path to the first ancestor of _this node. The pathQL allows for more complex path navigation.
Thing.getPaths(String pathQL) returns PathResults
Returns all paths referenced by the pathQL, for example “:parent{1..5}” returns an iterator, starting with the shortest path, for all paths to the ancestors of _this node. The pathQL allows for more complex path navigation.
Path Patterns
Spreadsheets are not limited to accessing just adjacent cells; neither is the IntelligentGraph. PathPatterns provide a powerful way of navigating from one Thing node to another. PathPatterns are inspired by SPARQL and propertyPaths, but a richer, more expressive, PathQL was required for the IntelligentGraph.
Examples
Examples of PathQL patterns are as follows:
_this.getFact(“:hasParent”)
will return the first parent of $this.
_this.getFact(“^:hasParent”)
will return the first child of $this.
_this.getFacts(“:hasParent/:hasParent”)
will return the grandparents of $this.
_this.getFacts(“:hasParent/^:hasParent”)
will return the siblings of $this.
_this.getFacts(“:hasParent[:gender :female]/:hasParent”)
will return the maternal grandparents of $this
_this.getFacts(“:hasParent[:gender :female]/:hasParent[:gender :male]”)
will return the maternal grandfather of $this.
_this.getFacts(“:hasParent[:gender [ rdfs:label “female”]]”)
will return the mother of $this but using the label instead of the IRI.
_this.getFacts(“:hasParent[eq :Peter]/:hasParent[:gender :male]”)
will return the grandfather of $this, who is the parent of :Peter.
_this.getFacts(“:hasParent[ne :Peter]/:hasParent[:gender :male]”)
will return grandfathers of $this, who are not the parent of :Peter.
The following diagram visualizes a path through a genealogical graph, from _this to the find the parents of a maternal grandfather born in Maidstone:
_this.getFacts(“/:parent[:gender :female]/:parent[:gender :male, :birthplace [rdfs:label ‘Maidstone’]]/:parent”)

Figure 4: PathPatternQL Example
How Is Performance?
IntelligentGraph takes the following actions to improve performance:
- All intermediate calculation results are cached, keyed by the subjectNode, predicate, and customQueryOptions.
- Cache can be cleared using the SPARQL function ClearCache.
- The SPARQL function ObjectValue takes as its argument the subject, predicate and objectValue. If the objectValue supplied is not of script datatype, the function will immediately return the objectValue.
- Circular functions, in which A calls B calls A, are detected and rejected.
Can I Debug?
Since IntelligentGraph combines calculations with the knowledge graph, it is inevitable that any evaluation will involve calls to values of other nodes which are in turn calculations. For this reason, IntelligenrtGraph supports tracing and debugging:

Figure 4: Tracing Calculation
How Do I Add Intelligence to my RDFGraph?
Download
The project is located in Github, from where the intelligentgraph.jar can be downloaded from there:
The intelligentgraph.jar does not include all of the scripting etc language dependencies, so to use it you would have to be certain all dependencies are already available.
Install
IntelligentGraphwill work only with RDF4J version 3.3.0 and above.
Copy intelligentgraph.jar
To /usr/local/tomcat/webapps/rdf4j-server/WEB-INF/lib/intelligentgraph.jar
The RDF4J server will need to be restarted for it to recognize this new JAR and initiate the scripting engine.
[1] In this case the script uses Groovy, but any Java 9 compliant scripting language can be used, such as JavaScript, Python, Ruby, and many more.